The 1980s took Topps baseball cards from “kind of scarce and kind of messy” to “printed by the truckload.” You can see the shift in the printing math (726 cards becomes 792), in print run estimates (hundreds of thousands per card becomes millions), and in modern PSA population data (what collectors actually bother grading).
The decade that turned baseball cards into a mass market
1980s Topps print runs are the reason the hobby feels like it has two different timelines. Early 1980s cards still behave like the 1970s: smaller production, more wear and tear over time, and quality that could be… optimistic. Then the mid to late 1980s hit, and suddenly you have cards everywhere. In closets. In basements. In that one drawer nobody’s opened since dial-up.
The 1980s are the transition point where baseball cards stop being a relatively limited consumer collectible and start becoming a mass-produced product that people treated like an investment. That change didn’t happen just because fans loved baseball more. It happened because of competition, manufacturing choices, and straight-up volume.
Competition shows up, and Topps starts “trying harder”
In 1980, Topps was still effectively the flagship brand in a world where the pack experience and the set build were familiar: gum, wax, big base sets, and quality control that varied. In 1981, real competition from Fleer and Donruss helped force Topps to raise its game, both in presentation and in production.
And once Topps starts increasing production to meet demand (and to defend shelf space), the whole ecosystem shifts. More packs get printed, more cases hit stores, and more kids grow up thinking “I have thousands of cards, so surely I’m set for retirement.”
Narrator voice: you were not set for retirement.
The printing math that explains why sets got so big
Before you even talk about “how many cards got printed,” you need to understand how Topps built sets physically.
Step 1: Cards come off big sheets
Topps produced cards on large printing sheets. A common sheet layout is 11 cards across by 12 cards down, for 132 cards per sheet. That 132-card sheet format is not just trivia, it drives everything: collation, checklist size, and how often certain cards repeat. If you have a sheet with 132 slots, your set size starts to want to “snap” to multiples of 132.
Step 2: Why 726 existed (and why double prints happened)
From 1978 through 1981, Topps sets were 726 cards, and Topps used 66 double prints to make the sheet math work. In other words, some cards appeared twice on sheets to fill out the physical layout.
So, yes: the checklist wasn’t always “pure.” It was partly constrained by how many rectangles fit neatly on a sheet.
Step 3: Why 792 became the famous number
In 1982, Topps added 66 cards, and that let them manufacture six 132-card sheets with no double prints.
Do the math:
132 cards per sheet × 6 sheets = 792 cards
That’s where the famous 792-card set size comes from. It’s not a mystical collector number. It’s printing logistics winning the argument.
Print runs: the numbers Topps never officially gave you
Topps has not historically published clean, official “we printed exactly X copies of every base card” numbers for these sets. So when people talk print runs, they’re talking estimates drawn from hobby research, distribution patterns, and comparisons across eras.
The key point is not whether a specific estimate is off by 10 percent. The key point is the order-of-magnitude jump:
- Early 1980s: estimates often land around 600,000 to 750,000 copies per card.
- Mid 1980s (roughly 1984–1986): estimates often land around 1,000,000 copies per card.
- 1987: some estimates put Topps at about 2.5 million copies per card.
- 1988–1989: widely viewed as peak “junk wax” output, often discussed in the multi-million per card range. (You’ll see estimates around 3.5 million for some late-80s flagship years, and occasionally higher.)
This is the moment where scarcity starts collapsing. Even if a card is “old,” it might not be scarce. And even if a card is common, its gem-mint version might be the thing that’s scarce.
That’s the weirdness of junk wax collecting in one sentence.
PSA population data: what grading tells you (and what it doesn’t)
Fast forward 40-plus years and PSA grading is now a major part of the hobby. PSA population reports don’t tell you exact print runs, but they do reveal two important things:
- Collector attention: which sets and cards people care enough to grade.
- Condition reality: how difficult it is to find truly high-grade copies.
It’s also worth saying the quiet part out loud: grading behavior is driven by economics. If a card in PSA 7 sells for $1, people don’t rush to grade PSA 7s. If that same grade sells for $100, people will absolutely send it in.
What PSA pop totals look like across the 1980s (Topps flagship)
Here’s the simple version: total PSA-graded cards for an entire set (not a single card). These totals change over time, but they show the trend.
- 1980 Topps: 165,353 graded cards
- 1981 Topps: 129,777
- 1982 Topps: 142,080
- 1983 Topps: 173,919
- 1984 Topps: 100,131
- 1985 Topps: 183,462
- 1986 Topps: 71,936
- 1987 Topps: 142,349
- 1988 Topps: 40,505
- 1989 Topps: 50,950
That shape tells a story.
- Early 80s sets have higher grading interest than you might expect because the key cards actually matter.
- Mid 80s sees spikes and dips depending on rookies and how “gradeable” the set is.
- Late 80s flagship sets are massively overproduced, and grading interest drops hard unless a specific card has real value in top condition.
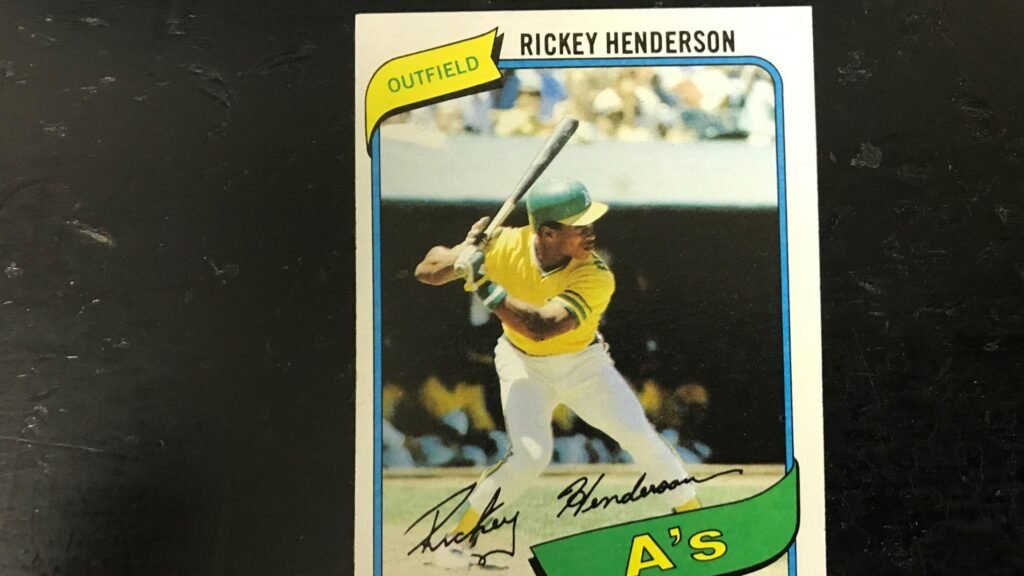
1980 Topps as the baseline: lots of history, one mega-rookie
The 1980 Topps set has 726 cards, and it’s anchored by one card that basically runs the whole show: the Rickey Henderson rookie.
If you take the set-level PSA population total (165,353) and spread it across 726 cards, you get an average of about 228 graded copies per card. That’s already a useful mental model: in a typical year, most cards are “binder cards” and only a small fraction get slabbed.
Then Rickey shows up and says, “hold my stolen base record.”
Rickey Henderson: the submission anomaly
On PSA’s own data, Rickey Henderson’s 1980 Topps rookie has been graded in enormous volume relative to a typical card from the set. And what makes the card extra interesting is not just how many exist, but how they grade.
Here’s the punchline: PSA 10s are incredibly rare for this card, while midgrades like PSA 7 and PSA 8 are heavily represented. There are also plenty of low-grade copies, which tells you how rough real-world storage conditions were for cards from that era.
A few takeaways that matter:
- Older cards have had more time to get wrecked. Corners soften, edges fray, centering issues become more obvious, and surface wear adds up.
- Even if the print run was “only” in the hundreds of thousands, the number of gem copies can be tiny.
- High value creates its own grading loop: because the card is valuable, people grade it. Because people grade it, we get more visibility into how hard PSA 10 really is.
So when someone says “they printed 600,000,” the right follow-up question is: “cool, but how many look perfect?”
For the Rickey rookie, the answer is: not many.
The rookie card effect: why some years spike and others fade
The transcript you provided points out a pattern that is still basically true in modern grading behavior:
- A set with one monster rookie can drive an unusually high share of grading submissions.
- A set with multiple popular rookies can spike too.
- A set with no major rookie chase tends to get graded less, especially if the commons aren’t worth the grading fee.
You can see that logic in the PSA totals above.
1981–1982: fewer “must grade” cards, fewer submissions
1981 and 1982 are still important sets, but they don’t have a Rickey-level grading magnet. Their PSA totals drop compared to 1980, even though they are only one year newer.
1983: popular rookies bring attention back
1983 Topps carries multiple highly collected rookies, and you see grading interest rise accordingly. Even when print runs rise, collector demand can overpower the supply side.
1984–1986: print runs climb, grading doesn’t follow evenly
By the mid-80s, estimated print runs are higher, and Topps is trying to keep quality up while producing more. But grading behavior is not just “more cards equals more grading.”
Two practical things matter a lot here:
- Design that reveals flaws. A border style can make centering and edge issues obvious.
- Whether the “key cards” justify grading. If the big rookies are there, people submit. If not, they don’t.
1986 Topps is a great example of this. It’s notorious for being hard to grade cleanly, and the PSA total for the set is dramatically lower than nearby years.
1987: when the hobby tips into junk wax for real
If you had to pick a single year where the mainstream hobby experience changed, 1987 is a strong candidate.
Topps made two big moves:
- Design reset: an homage look that was more appealing than the prior year’s problem design.
- Production jump: estimates commonly put 1987 far above the mid-80s output, in the multi-million-per-card neighborhood.
This is where the hobby becomes “everywhere all at once.”
What’s funny is that 1987 is also a set with genuinely collectible cards. PSA itself calls out rookie cards like Bo Jackson and Barry Bonds in the 1987 checklist. Yet the overall submission rate still gets diluted because the product is everywhere.
A clean comparison: Rickey (1980) vs Bonds (1987)
If you compare two iconic cards from these years, the contrast is sharp:
- The 1980 Rickey Henderson rookie has a huge graded population, but gem mint copies are scarce.
- The 1987 Barry Bonds rookie has a very large graded population too, but high grades are much more common. PSA 10s exist in real quantity for Bonds.
That doesn’t mean 1987 quality control was perfect. It means that when you print a ton of cards, you inevitably create more clean copies, and the typical collector also had less time to destroy them.
Time is undefeated, but it needs decades to do its work.
1988–1989: peak overproduction, and the grading cliff
By 1988 and 1989, the “junk wax era” label makes intuitive sense. Even Topps uses the term to describe the late-80s and early-90s flood of product that created a supply-demand imbalance.
Here’s the part collectors still trip over: a massive print run does not automatically mean high PSA totals. It often means the opposite, because the cards have low value unless they grade extremely high.
If a card is worth $1 raw and $3 in PSA 8, nobody is paying grading fees for the privilege of learning they own a $3 card.
So the set-level PSA totals drop hard in 1988 and stay low in 1989, even though far more cards were produced.
What actually drives value (and why the 1980s still matter)
After all the printing talk and pop report math, card value still reduces to two things:
1) Scarcity (real scarcity, not “i don’t see it often”)
Older sets can become scarce in high grade simply because fewer cards survived clean. Corners, edges, centering, surface, print defects, and storage damage all reduce the pool of pristine cards.
Late-80s sets are often the opposite: there are still plenty of clean raw copies available because so many exist.
2) Appeal (player, story, nostalgia, and the set’s identity)
A set can be common and still beloved. A card can be technically available and still expensive in PSA 10 because gem copies are scarce. The hobby is full of those contradictions, and the 1980s are where most modern collectors learned them.
Practical takeaways if you collect 1980s Topps
If you want a simple checklist for thinking about 1980s cards:
- Ask “how hard is PSA 10” before you assume a card is cheap. Some commons are sneaky difficult in gem.
- Treat print run estimates as ranges, not gospel. They’re useful for understanding scale, not for pretending we know exact factory numbers.
- Use PSA set population totals as a proxy for collector interest. It’s not perfect, but it’s real behavior, not theory.
- Don’t ignore design. Border-heavy sets punish centering and edges. Cleaner designs can hide flaws and grade better.
- Remember the grading economics. People grade what has upside.
And if you’re holding a stack of late-80s commons hoping one is secretly a gold mine, i mean… good luck. But maybe start by looking up the PSA 10 population first.
Conclusion: the 1980s built the modern hobby
The 1980s will always be a fascinating decade because it’s when the manufacturing and business side of cards collided with collector psychology. Print runs grew, set construction shifted, competition reshaped quality expectations, and the junk wax era taught the hobby a harsh lesson about supply.
Today, PSA population data gives us a way to see that story in numbers: what got graded, what stayed raw, and why certain “common” cards still become expensive when you chase perfection.
That’s the 1980s in a nutshell: plenty of cardboard, not enough gem mint.